What's New - 7 December 2017
Graph-It enhancements
We are delighted to add new capabilities to Graph-It that now allow the visualization of Sectors, Regions and PESTLE criteria as well as the existing Topic analysis. Thanks to Renee Byrne for the original Sector suggestion which we then extended. See example below using ‘Climate’ as the search term and set to evaluate forward Sector Intensities in 2030.

Just set the new Show panel to Topic (Default), Sector, Region or PESTLE to change the graph. Then set the y-axis to Intensity and select a year in the timeline to see which Topics, Sectors, Regions or PESTLE criteria are likely to have the biggest impact on the future (top right-hand quadrant).
Member searches
You can now see what you and other members are searching on and use this to better inform your own knowledge of emerging opportunities and risks. Member ‘Searches’ appear under Members in the left-hand navigation bar of the database page.
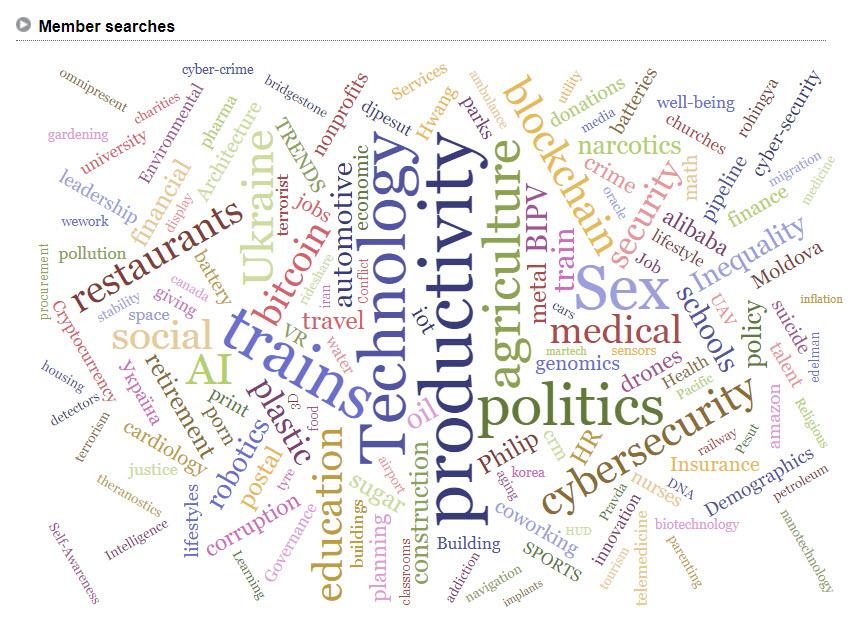
Thanks to Richard Hames, Centre for the Future for this suggested improvement.
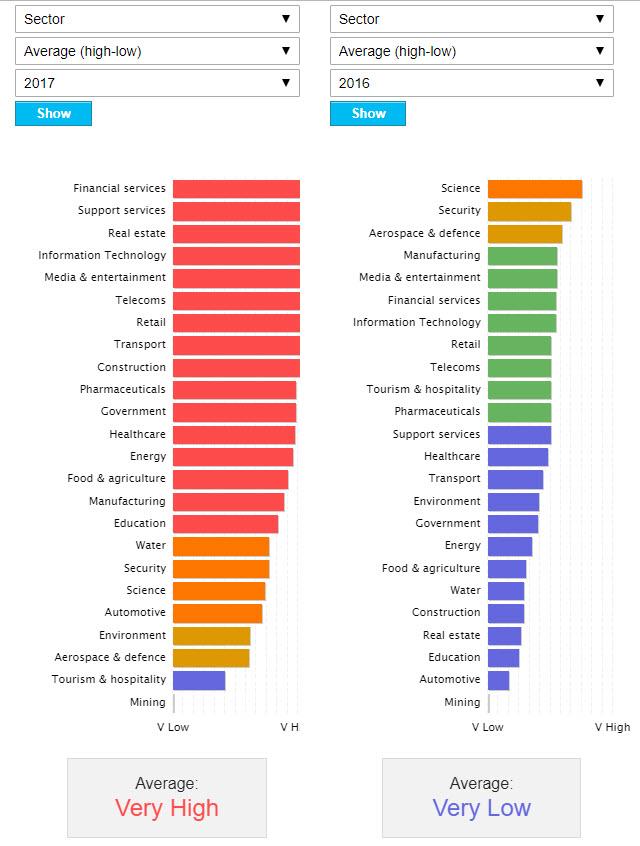
Year-on-Year
The Graph-It enhancement above looks at leading indicators for where Sectors, Regions and PESTLE criteria are headed. This new lagging indicator compares one year to another for the same indicators going back to 2014. It’s a quick way to see movement and who and what are the most affected by emerging change.
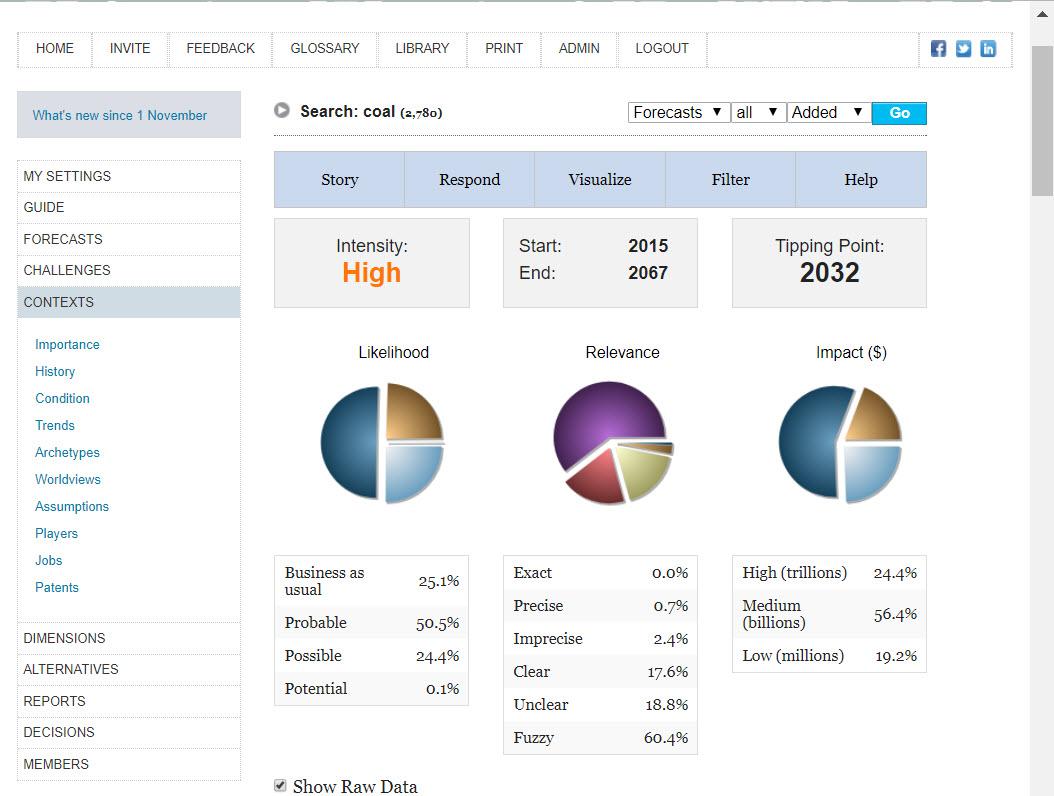
Metric Relevance values
We have now found a way to display the description of Relevance values in line with the way Likelihood and Impact display.
Challenge Sources
These now show as alt-tags when you hover your mouse over the Challenge title.
Thanks to Susan Parsons, Ordnance Survey for this suggestion.
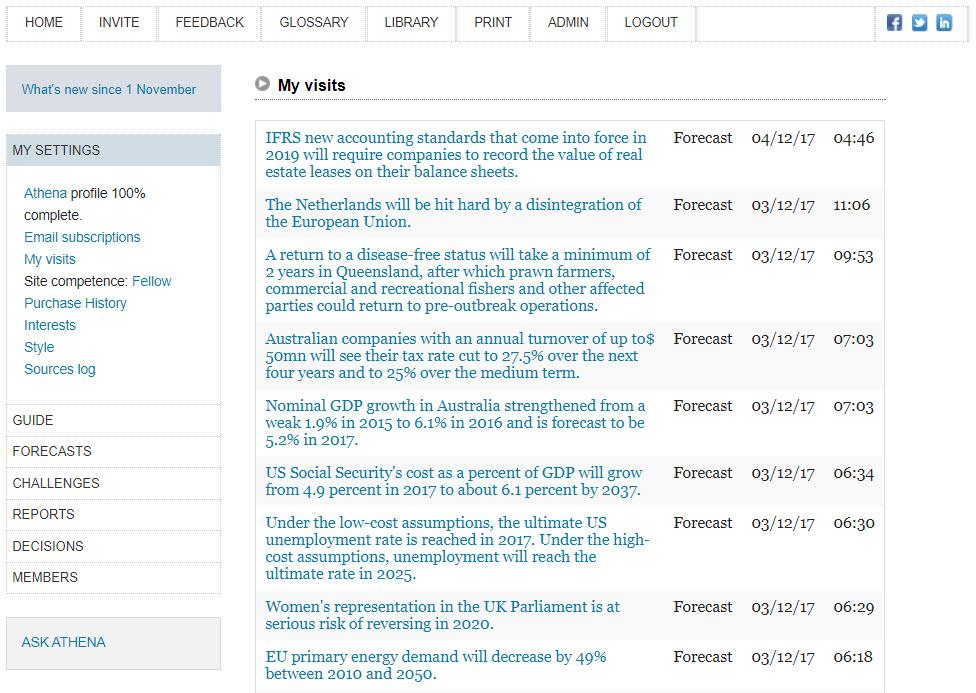
Your visits
You can now see which Insights and Forecasts you have visited and return to the original links.
Improved Sort
We have changed the default sort to make ‘Latest’ show those items just published on the internet. We have also created an ‘Added’ sort to show which items have recently been added by Athena regardless of publication date.
Thanks to Linda Walden of the Co-op, UK, for this suggestion
What’s on the way?
Expect to see a new ‘Knowledge graph’ in early 2017 designed to provide structured and detailed information about your interest topics.
Happy futuring
The Shaping Tomorrow team